Grass Motion: 9/17/08
graphite following shadow of grass seed head on paper - 24 x 19”
The Grass Motion series is a set of three graphite drawings reflect an intimate response to the immediate landscape by capturing the movement of different grasses in the wind. The grasses shadows on the paper were followed with a pencil as the seed heads moved in the wind.
|
|
Grass Motion: 9/22/08
graphite following shadow of grass seed head on paper - 24 x 19”
|
|
Grass Motion in Wind: 10/10/08
grass seed head dipped in ink and held to paper - 19 x 24”
The Grass Motion in WindSeries is a set of three ink drawings reflect a more intimate response to the immediate landscape by capturing the movement of varied grasses in the wind. The grasses, when dipped into ink create the drawings themselves through idiosyncratic movements.
|
|
Grass Motion in Wind: 10/10/08
grass seed head dipped in ink and held to paper - 19 x 24” |
|
New Mexico Grass/June
ink on paper - 19 x 24”
A traditional, pictorial view of the desert outside the studio window.
|
|
Rolled Globe: North of Equator
paper and light - 7 x 53 x 7”
This drawing is another version of “Longitude/Latitude and Northern Continent Lines.” All Maps are subjective and situational, so what interpretation can be given in each instance?
|
|
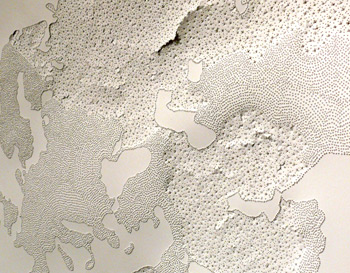
Freedmen’s Cemetery: Projected Lines of Disrupted Graves with 20th Century Office Building, Gas Station, Oil Tanks, and Utility Lines
paper, screen, thread - 22 x 30”
The drawing is a visual estimation of forgotten and destroyed graves on land West of S. Washington St. and South of Church Street in Alexandria. In 1864, this property was designated a cemetery by the federal government for freed slaves and contrabands. It is estimated that at least 1,800 adults and children were buried in this location, buy by 1869, the cemetery began to fall into disrepair, and was last seen on a map in 1939. The cut portions of the drawing portray graves (some incomplete) still in place as located by the Archeology Museum. The pin pricked graves show an estimation of what the site may have looked like in 1869. The rectangular forms on the drawing represent the recently destroyed office building, gas station, and utility lines (still evident on GoogleEarth satellite views). What occurred in this small area of land over the course of 140 years in Alexandria tells a complex story. Why was the cemetery across East of S. Washington Boulevard maintained and not this area of land? What does such disruption represent, and how does the changing use of this small area of land in an urban setting tell a quintessentially American story?
|
 |
Jamieson Bakery Cistern
graphite on paper - 14x 17”
Just north of the project area, at Lee and Oronoco streets, Scotland native Andrew Jamieson began baking an assortment of best white biscuits or crackers in 1785. By 1836, the bakery had moved to the project area, to a three-story brick building at the northeast corner of Lee Street and Thompson's Alley. It has been said that Jamieson made Alexandria famous by his crackers. The products must have been highly esteemed as Queen Victoria as a young woman so relished them that she imported them for the Royal table. The brick footings of the late nineteenth-century warehouses were unearthed beneath the asphalt parking lot. And under these, the massive stone foundations of the three-story brick bakery of Robert Jamieson were discovered. Three rooms comprised the main floor. North of the bakery was a well, perhaps the earliest water supply for the building. The well-preserved brick domed cistern, located in the second room, was probably also used to supply water for baking and for the operation of a steam engine boiler used to heat the large rectangular ovens.
~ excerpt from City of Alexandria Archeology Museum
|
 |
Longitude/Latitude and Global Continent Lines
graphite on paper - 64 x 24 x 13”
This piece includes the cut, lattice-like longitude and latitude lines from a global map. The graphite or drawn portions of piece show where the edges of continents cross those cartographic lines. This piece continues an interest in abstracting and shifting global maps into something new, thereby asking the question of how and what maps attempt to teach as a source of powerful information. The piece takes, as a starting point, a two-dimensional map, and then makes it three-dimensional again, but in a different form other than the original globe or sphere. |

|
Top Ten Oil Extractors in 2007
paper - 52 x 70”
The map shows the countries that extracted the most oil from the earth in 2007. The piece was made in the summer/fall of 2008, when oil prices were very high, and just before the global economy started collapsing. This is a kind of ‘current event’ piece, showing the influence of the media and contextual events on the content of the work. It is more a drawing of a tiny portion of the economic landscape at that time. In my own timid way as an artist (not a scientist or cartographer), I seek to develop a keener sense of earth distributions of resources and of peoples and their activities. But I am interested as well in how the work functions beyond just a map.
|

|
Longitude/Latitude and Northern Continent Lines
graphite on paper - 51 x 42 x 10”
This piece includes the cut, lattice-like longitude and latitude lines from the northern portion of a global map. The graphite or drawn portions of piece show where the edges of continents cross those cartographic lines. This piece continues an interest in abstracting and shifting global maps into something new, thereby asking the question of how and what maps attempt to teach as a source of powerful information. The piece takes, as a starting point, a two-dimensional map, and then makes it three-dimensional again, but in a different form other than the original globe or sphere.
|
 |
The New Oil: New Mexico Water
paper - 59 x 50”
New Mexico is often short in water supplies, and so the discussion of water is an ongoing part of the political and environmental landscape. Oil and gas pumps on the land as well as refineries use much water in addition to farmers and cities, so the connection between a valuable limited resource (such as Oil) seems natural. In the future, water will become more valuable as a commodity rather than as something assumed to be available to all. This is a global as well as local phenomenon. In this and many of the drawings seen here, I wish to ask, how can these maps/drawings connect to current events or the landscape directly, on a local and/or global level?
|
 |
Flat Map IV
paper, pins - 17 x 14”
The Flat Map Series are abstractions of a series of global maps, and include only the longitude and latitude lines.
|
 |
Flat Map Series VI
paper, pins - 17x14" |
 |
Migration Series: Starlings
graphite on paper - 52 x 72”
Large flocks of Starlings are often seen above the alfalfa fields around the Roswell residency. The flocks are famous for their playful, compact, and ever-changing movements, as if they are schools of fish. Their energetic flight is mesmerizing: an effervescent, shifting, value range of grey against sky.
|
 |
Migration Series: Bats
graphite on paper - 52 x 72”
The Carlsbad Caves in Southern New Mexico are the roost for thousands of Mexican Brown Bats. Their flight patterns differ greatly from Sandhill Cranes and Starlings, as seen in this exhibition. This drawing, along with the other flight and grass drawings show an interest in finding and capturing ephemeral lines of movement
in the landscape.
|
 |
Migration Series: Sandhill Cranes at Bitter Lake, NM
graphite on paper - 52 x 72”
Sandhill Cranes winter near Roswell at Bitter Lake. Every morning the cranes disperse Northward: their calls are mellow, and the wings whistle as they fly. Every evening, thousands of cranes gather again at Bitter Lake. I photographed their flight pattern in the sky, thinking of them as sky drawings. The daily repetition of their calls and lines in the sky are what first attracted me to the project of drawing and comparing flight lines in sky. |
 |


